


The impact of the population segment with higher education on GDP growth
This study explored the impact of the population segment with higher education on GDP, taking the proportion of people aged 25–34 years who had completed higher education (B) and the proportion of people aged 25–64 years who had completed higher education (A) as the independent variables for the OLS regression. The square value of model R was 0.097, indicating that the two independent variables could explain 9.73% of the change in GDP. The model passed an F test (F = 46.137, p = 0.000 < 0.05), indicating that at least one of the two independent variables impacted the GDP regression coefficient (C). The following formula was used:
$${\rm{C}}=-4.763-0.813\ast {\rm{B}}+1.553\ast {\rm{A}}$$
The final analysis revealed that the regression coefficient value of A was 1.553 and the significance level was 0.01 (t = 7.141, p = 0.000 < 0.01). Therefore, A had a significantly positive influence on C. Accordingly, the proportion of the population aged 25–64 years who had completed higher education, that is, the overall level of development of higher education was found to have a positive impact on GDP. The influence coefficient value was 1.533, indicating that an increase in the proportion of the population with completed higher education led to an increase in GDP.
The regression coefficient value of B was −0.813 at a 0.01 level of significance (t = −4.300, p = 0.000 < 0.01), indicating that B had a significantly negative influence on C. The proportion of the population aged 25–34 years who had completed higher education, that is, the degree of popularisation of higher education had a negative effect on GDP, and the influence coefficient value was −0.813.
The negative impact on economic and social development caused by an increase in the popularity of higher education and the proportion of young people’s higher education experience may be attributed to the excess capacity of higher education. The development of higher education should be adapted to the national context. An excess of higher education and a lack of investment lead to a rise in the social cost of education and a decline in social outputs, which hinder social and economic development. At the same time, young people aged between 25 and 34 years occupy the position of’ export’ in the education process. With the increasing popularity of higher education, the supply of talents in the labour market generated through the recruitment of former higher education exceeds the demand for graduates with higher education within recruiting organisations. Consequently, issues such as wasted educational resources and knowledge, unemployment, excessive education, excess talents, an imbalance in the structure of higher education, excessive expansion and decreasing compatibility undermine economic operations and hinder GDP growth.
In this study, the variance decomposition and Pearson coefficient based on covariance calculation were analyzed. The variable of the number of 25–34-year-old who have completed higher education as a percentage of their peers explains 50.74% of the change in GDP. The variable of the proportion of 25–64-year-old who have completed higher education explains 49.26% of the change in GDP. The variable of 25- to 34-year-olds who completed higher education as a percentage of their peers explained 45.88% of the change in poverty line. The variable of the proportion of people aged 25–64 who have completed higher education explains 54.12% of the change in GDP (See Table 2).
The proportion of people aged 25–34 who have completed higher education in their peers and the proportion of people aged 25–64 who have completed higher education in their peers, GDP and poverty line showed significant correlation coefficients. The correlation between the proportion of people who have completed higher education at the age of 25–34 and the proportion of people who have completed higher education at the age of 25–64 is 0.931, and shows a significance of 0.01, which indicates that there is a significant positive correlation between the proportion of people who have completed higher education at the age of 25–34 and the proportion of people who have completed higher education at the age of 25–64. The correlation between the proportion of the number of people who have completed higher education at the age of 25–34 and the GDP is 0.209, and the significance is 0.01, which indicates that there is a significant positive correlation between the number of people who have completed higher education at the age of 25–34 and the GDP. The correlation between the number of people who have completed higher education and the poverty line at the age of 25–34 is −0.365, with a significance of 0.01, indicating a significant negative correlation between the number of people who have completed higher education and the poverty line at the age of 25–34 (See Table 2).
White test and BP test were used in this study. The test null hypothesis is that the model has no heteroscedasticity. The table above shows that both tests reject the null hypothesis (p < 0.05), indicating that the model does have heteroscedasticity. When there is a heteroscedasticity problem, Robust and robust standard false regression is used (See Table 3).
The impact of a population segment with higher education on the poverty line
This study also explored the impact of a population segment with higher education on the poverty line. Specifically, this study performed an OLS regression in which the proportion of people aged 25–34 years who had completed higher education (B) and the proportion of those aged 25–64 years who had completed higher education (A) were the independent variables. As Table 2 shows, the R squared value was 0.134. This means that variables A and B could explain 13.37% of the change in the poverty line (D). The model passed the F test (F = 48.771, p = 0.000 < 0.05), which means that at least one variable (A or B) had an impact on the poverty line. The formula for the change in the poverty line was expressed as follows:
$${\rm{D}}=2.284-0.048\ast {\rm{B}}+0.005\ast {\rm{A}}$$
The final analysis revealed that the regression coefficient value of the proportion of people aged 25–64 years who had completed higher education (A) was 0.005 but with no significance (t = 0.428, p = 0.669 > 0.05), indicating that the population segment with higher education did not have an impact on the poverty line.
The regression coefficient value of the proportion of people aged 25–34 years who had completed higher education (B) was −0.048 at a significance level of 0.01 (t = −4.305, p = 0.000 < 0.01), which means that in relation to their peers, the proportion of people aged 25–34 years who had completed higher education had a significantly negative impact on the proportion of poor people. A higher proportion of people aged 25–34-years who had completed higher education corresponded to a higher penetration rate of higher education and a lower proportion of those living in poverty. This phenomenon can be attributed to OECD’s support for the development of higher education in various countries. When the development of higher education reaches a certain level, the reduction of the proportion of the population segment experiencing poverty will no longer be affected by a simple expansion of the scale of extended higher education and the superposition of the total number of highly educated human resources. It will be influenced more by the reasonable distribution of educational resources and educational equity within higher education and its popularisation, that is, the increase in the proportion of the school-aged population aged 25–34 years based on the increase of the previous enrolment rate (see Table 4).
The effect of adult education on GDP growth
For quantile regression analysis, a total of nine models (with decimal points ranging from 0.10 to 0.90 and at intervals of 0.10) were estimated in this analysis, which aimed to explore the impact of the independent variables A and B on the dependent variable, GDP (C). When the quantile value was between 0.1 and 0.3, the proportion of the population aged 25–64 years who had completed higher education (A) had no significant positive impact on GDP growth, indicating that the development of higher education did not significantly affect economic and social development in poorer OECD countries. When the quantile value was between 0.4 and 0.6, the level of development of higher education had a significantly negative impact on economic and social development. Thus, for a country that had developed over a period, the advancement of higher education required multiple inputs, such as capital, material, and human resources.
During the early stage of the development of higher education, such inputs may, however, have a negative and weakening impact on social and economic development. The added cost of education and the lag between the output of educational achievements and the input of talents puts increased pressure on economic and social development during a certain period. When the quantile value was 0.7 or higher, the improvement of the overall level of higher education had a significantly positive impact on GDP growth, indicating the realisation of the talent training outcomes of higher education. Teaching and research outcomes were thus transformed into socially productive resources and power, with talents with higher education contributing to economic and social development.
When the quantile value was 0.1, the proportion of people aged 25–34 years who had completed higher education in relation to their peers (variable B), indicating the popularisation of higher education, had no significant impact on GDP growth. Thus, in extremely backward countries, the popularisation of higher education had little effect on economic and social development. When the quantile value ranged between 0.2 and 0.6, the popularisation of higher education had a significantly positive effect on GDP growth, indicating its contribution to economic growth.
When the quantile value was 0.7, the influence of variable B on variable C was no longer significant, indicating that social development would soon face the problem of overcapacity in higher education. When it exceeded 0.7, the ratio of eligible people aged 25–34 years who had completed higher education in relation to their peers had a significantly negative impact on GDP growth, revealing that with the development of the economy, society and education, higher education had become overexpanded. Thus, the cost of investing in education exceeded the social benefits, leading to overcapacity whereby the supply of higher education talents exceeded the demand. This situation led to wasted educational resources and excessive competition of talents, hindering economic growth (See Table 5).
The increased level of adult education and the proportion of the population experiencing poverty
Using the same model, this study explored the influence of the independent variables, A and B, on the poverty line (dependent variable D). The proportion of the population aged 25–64 years who had completed higher education (independent variable A) had no significant influence on the proportion of the population living in poverty, indicating that popularisation of education and economic and social development have been achieved to a certain extent in OECD countries, and improvements targeting the population experiencing poverty could no longer be achieved simply by increasing the volume and quantity of higher education. When the quantile value was 0.1, the proportion of people aged 25–34 years who had completed higher education in relation to their peers (independent variable B) had no significant effect on the proportion of the population experiencing poverty (dependent variable D). Therefore, the strategy of increasing higher education enrolment and the ratio of the eligible population through the fair allocation of educational resources, and thus the popularisation of education, would not be effective for a small population segment experiencing poverty. In other words, the population segment experiencing poverty in highly developed countries is less receptive to the popularisation of higher education. When the quantile value was 0.2, the independent variable, B, had a significantly positive impact on the dependent variable D, that is, an increase in the popularity of higher education led to an increase in the population segment experiencing poverty. This phenomenon can be interpreted as reflecting the inherent disadvantages of the welfare state in the field of education. A rise in the number of eligible young people aged 25–34 years who have completed higher education reflects the development trend of higher education towards fairness and popularisation following the redistribution of higher education resources.
The fair distribution of higher education resources leads to a lack of competition in the areas of teaching and career development. To a certain extent, reducing students’ willingness and enthusiasm to work may lead to poverty caused by the failure to achieve teaching results. When the quantile value was between 0.3 and 0.4, the independent variable, B, had no significant influence on the dependent variable D. In relatively poor countries, the popularisation of higher education contributes little to reducing the degree of poverty, so it may be necessary to explore ways of alleviating poverty from the perspective of improving the overall level and expanding the scale of basic higher education. When the quantile value was 0.5 or above, the independent variable B had a significantly negative impact on the dependent variable D, indicating that for countries with a relatively high proportion of their population experiencing poverty, the following strategy would be more effective.
Considering the quantile data, this study deemed that the degree of sensitivity of countries at different stages of economic development to the level of development and popularisation of higher education could be more intuitively evaluated using a radar map (see Fig. 2). Countries with sub-points 0.1–0.9 were defined along a spectrum as extremely backward, backward, moderately backward, slightly backward, moderate, preliminarily developed, moderately developed, developed, and highly developed. From the perspective of economic development, increasing the proportion of young people who complete higher education and popularising higher education had an obvious positive effect in backward and medium-developed countries, whereas the effect in highly developed countries was not obvious. Overall, the sensitivity of OECD countries to the high level of education penetration was found to be higher than the level of development of higher education. From the perspective of equitable economic development, the overall level of development of higher education had no significant impact on the poverty link in OECD countries, whereas OECD countries with differing economic development backgrounds and at varying stages of development evidenced relatively significant and stable sensitivity to the proportion of young and middle-aged people who completed higher education and the popularisation of higher education.
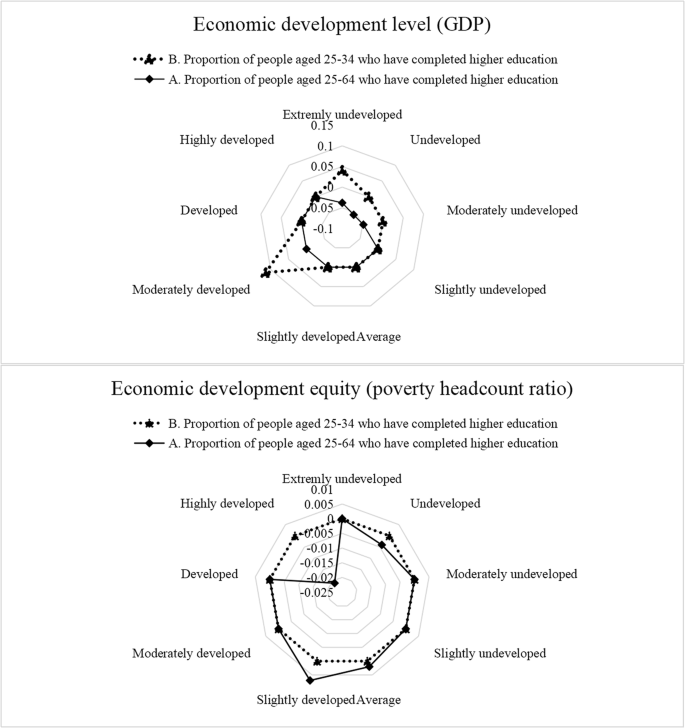
The dashed line represents the proportion of people aged 25–34 years who have completed higher education. The solid line represents the proportion of people aged 25–64 years who have completed higher education, the impact of the overall level of higher education.