


South Atlantic Anomaly — NASA
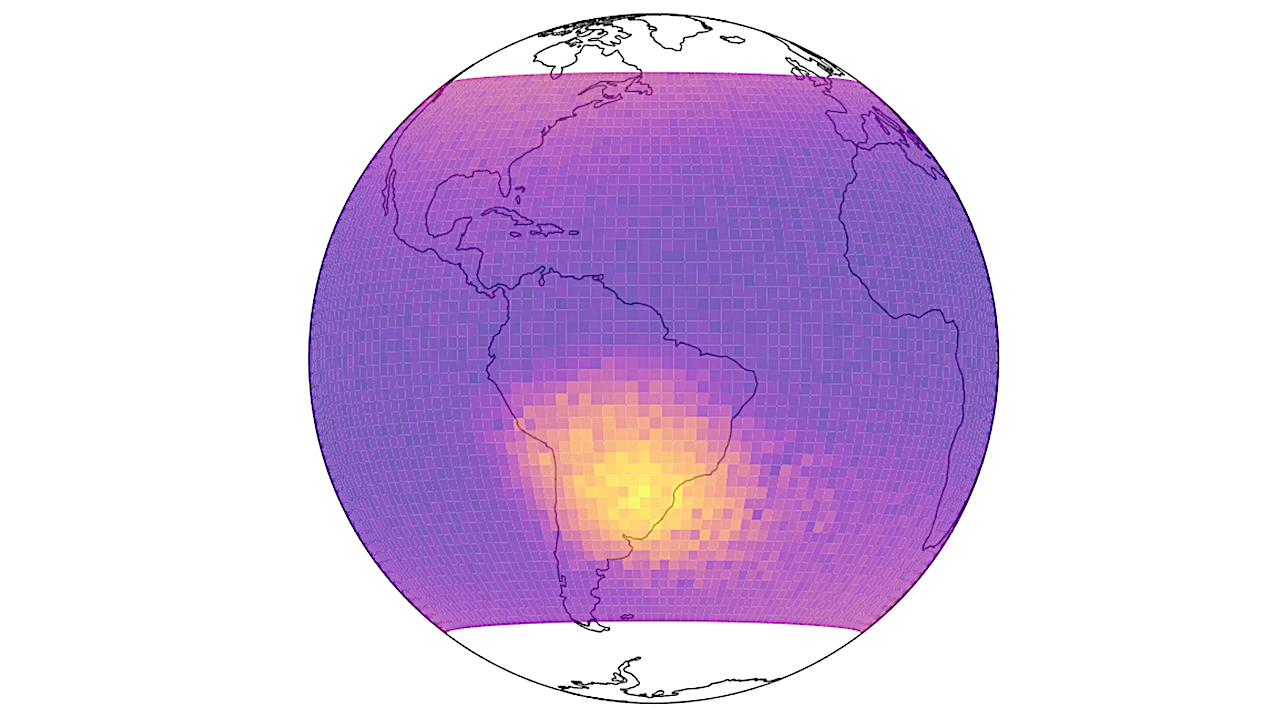
Dive into the realm of space with NASA's latest OSDR RadLab app. You can explore radiation data from multiple space agencies, track the total dose rate of the South Atlantic anomaly at a given point in time, and much more.
RadLab: https://visualization.osdr.nasa.gov/radlab/gui/data-overview/
RadLab Portal and RadLab Data API
RadLab is a portal intended to provide a single point of access to radiation telemetry data from multiple databases maintained by multiple space agencies.
The web interface provides the ability to query, visualize, inspect, and download data. Examples include time series plots of readings from multiple radiation detectors, pairwise comparisons of detector readings, and geospatial visualization of radiation doses and fluxes recorded by the detectors.
The underlying API allows data selection and retrieval at a programmatic level.
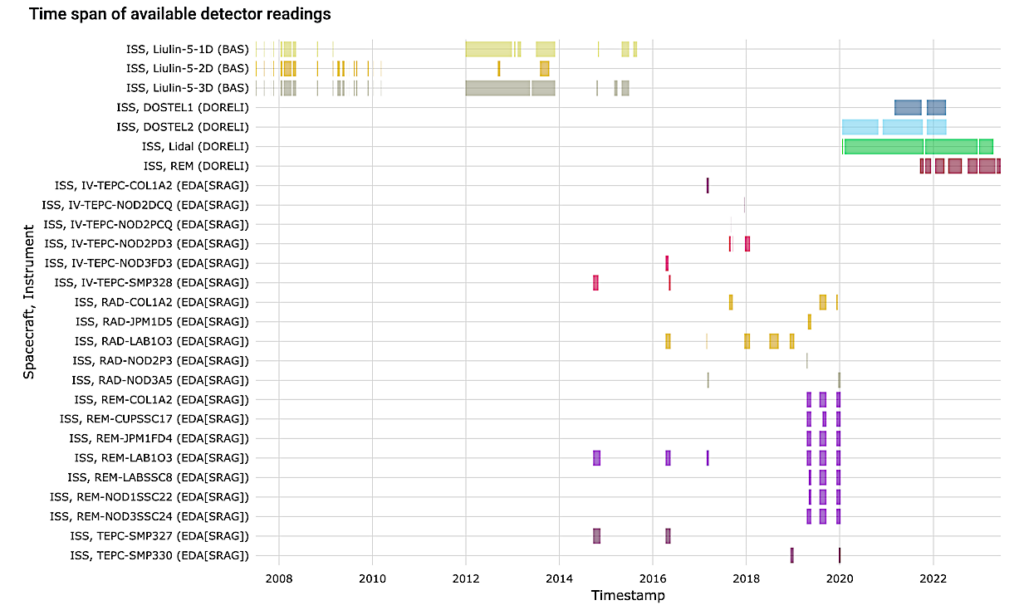
This release of RadLab includes four detectors included in the DORELI project (DOSTEL1, DOSTEL2, Lidal, REM, Italian Space Agency), three Liulin-5 detectors (Bulgarian Academy of Sciences), and multiple RADs, REM, and TEPC detectors handpicked from SRAG data by NASA and LBNL collaborators for time intervals corresponding to entries in environmental data applications.
All detectors are located on the International Space Station (ISS).
- Moving the mouse over the plot activates the interactive tools in the top right.
- Drag the mouse on the plot to zoom in, and double-click to zoom out.
- Click any box on the plot to visualize time series data for a specific instrument and time period.
astrobiology, astrobiology, open science,
